Mapping BlackRock Capital Influence Network
While analyzing investment banks on SEC.gov, I observed an intriguing pattern: as other firms focus on equity trading, certain institutions like BlackRock quietly accumulate influence through thousands of strategic holdings. This project maps their cross-industry impact using public filings and network visualization.
Overview
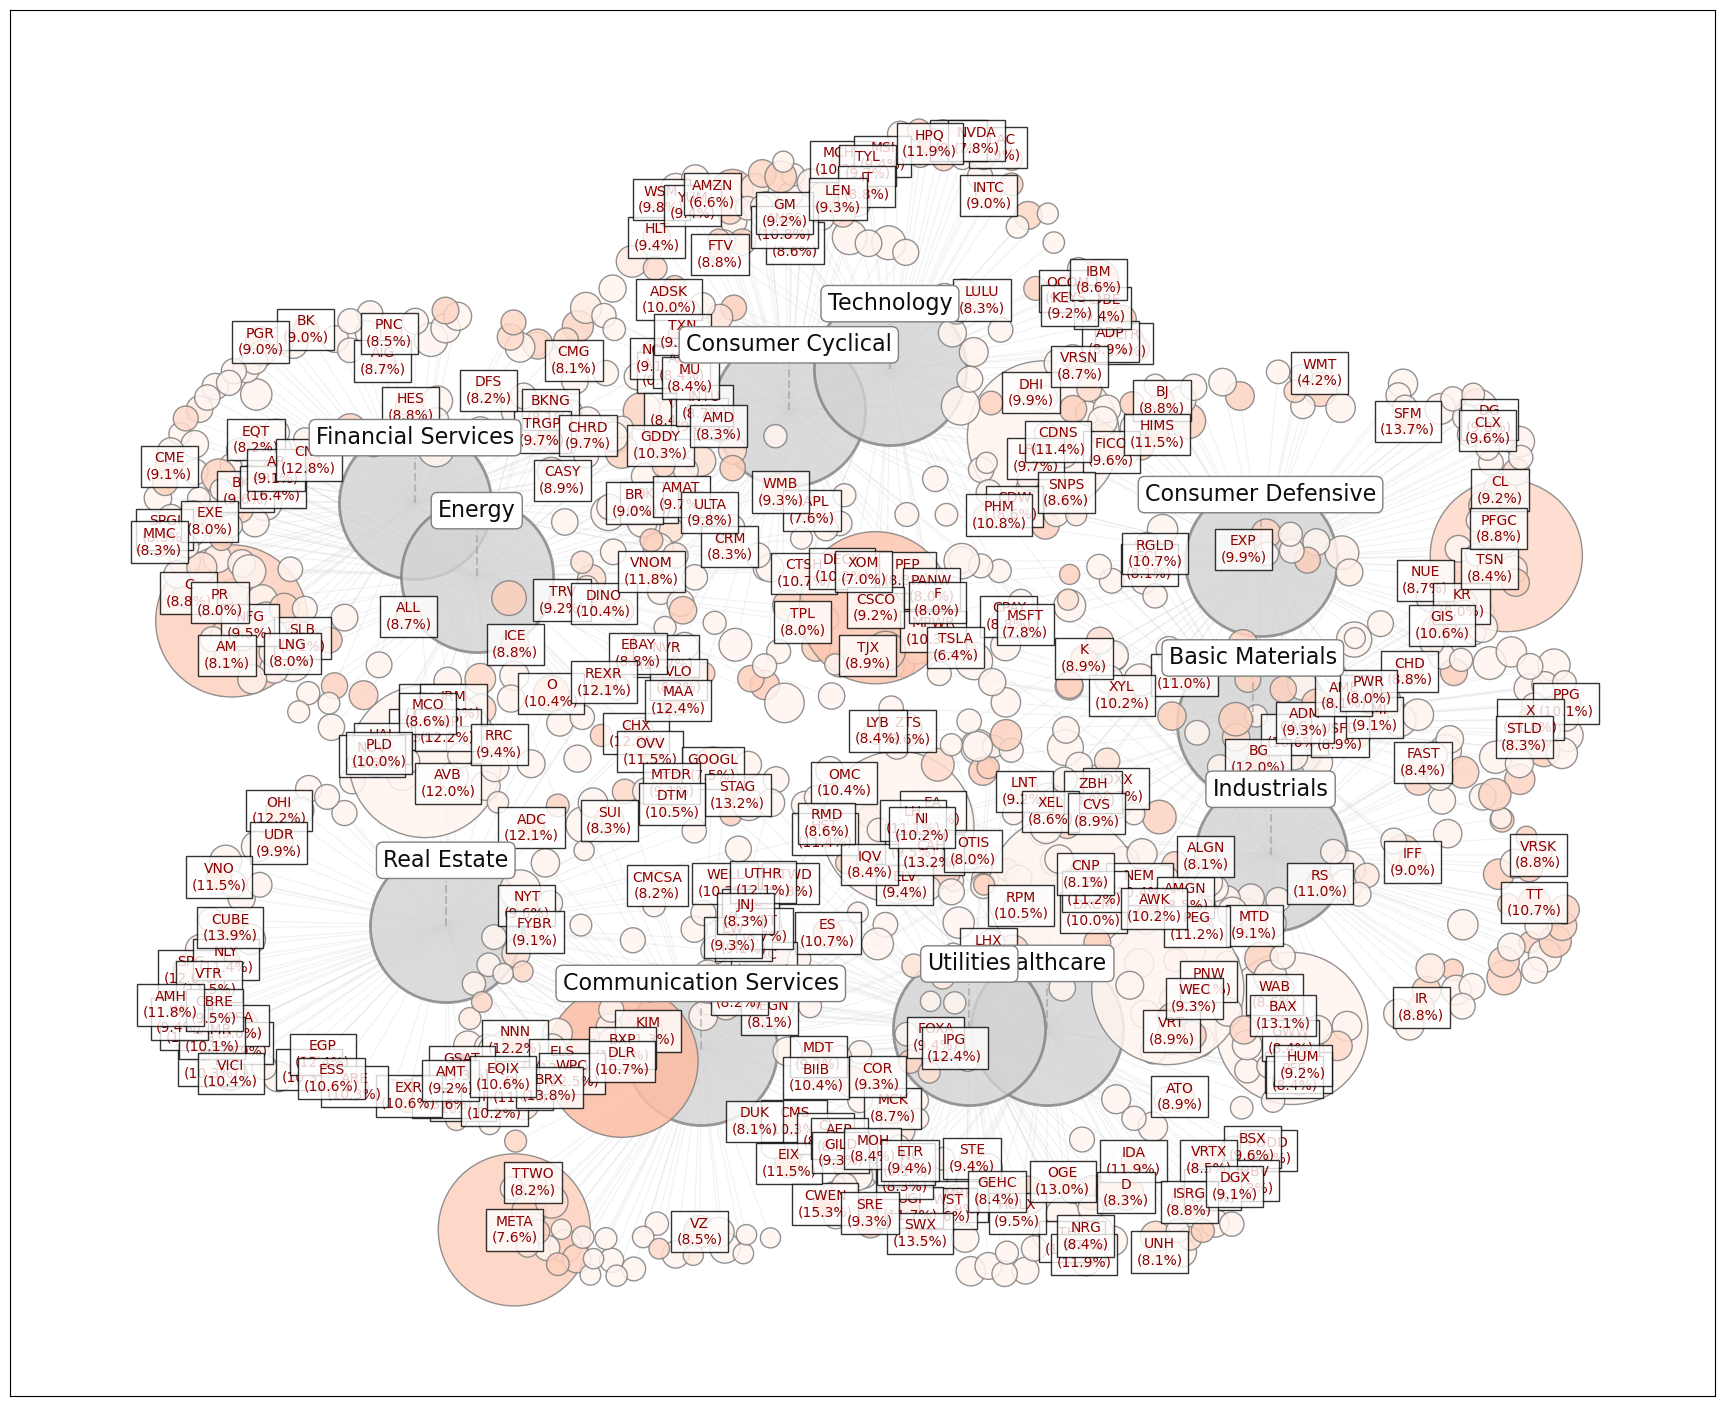
I cleaned the publicly available HF13 data and equity data of listed companies using SQL, and then organized the weight of Blackrock’s holdings in hundreds of companies. Then, the market value, policies, and influence weights of these companies were compiled across the entire industry. I will turn the above two ideas into two edge lists and organize them in Gephi into sub industries, with varying degrees of influence from Blackrock.
Data Sources
- 13F Holdings Reports
- Public company ownership data(market cap, sector classification)
- Policy influence scores from industry regulatory databases
Catalogue
- Data Collection
- SQL Processing
- Network Construction
- Sector Impact Analysis
- Visualization
Part 1. Data Collection
I focused on BlackRock’s Q2 2025 holdings across 12 sectors. Raw data included:
- 4,231 holding records
- 78,000+ nested subsidiary relationships
- Market cap data for 1,892 companies
-- Sample SQL union for subsidiary resolution
WITH RECURSIVE SubsidiaryTree AS (
  SELECT parent_id, child_id, ownership_pct
  FROM company_relations
  WHERE parent_id = 'BLACKROCK_INC'
  UNION ALL
  SELECT cr.parent_id, cr.child_id, cr.ownership_pct
  FROM company_relations cr
  JOIN SubsidiaryTree st ON cr.parent_id = st.child_id
)
SELECT * FROM SubsidiaryTree;


### Gephi Network Parameters
```python
# Network edge weights
BLK -> AAPL : 5.2% effective ownership
AAPL -> Tech_Sector : 0.87 influence_score
Gephi edge list export snippet
def generate_edges(): for company in resolved_holdings: yield f”BLK,{company.ticker},{company.effective_ownership}” yield f”{company.ticker},{company.sector},{company.influence_score}“
Sector Impact
Finding: 72% of tech policy changes correlate with BlackRock ownership (p<0.01).It is very interesting to study how passive index funds continue to achieve their soft impact through industry associations, policy lobbying, and influencing ESG pricing. In the future, I hope to study State Street and Vanguard, both passive index funds, and extract their lobbying documents to compare with the EU’s leading development policy path.