Personal Dashboard (Real-time)
This is a data dashboard project I created while studying finance. Compared to the index provided by large websites, I am more eager to uncover the many details of economic operations.
Check final Dashboard.
Step decomposition
I selected financial indicators on Yahoo, Alpha Vantage, and FMP, and then used Python’s data crawling function to classify and reorganize them. The reports on these websites are always incomplete, indicating that companies have not measured their respective indicators as expected. But we can still see what these companies have done from the ratio of cash flow to changes in their assets.
Catalogue
- Data Collection
- Analysis
- Income and expenditure analysis
- Asset proportion
- Long term financial health
- Outcome
Part1.Data Collection
I have selected the top thirty Nasdaq stocks updated in real-time from yfinance. Please note that re running them will update the latest list.
Import yfinance as yf
# Define the tickers
# I have selected thirty stocks from the Nasdaq component page on March 22nd
↪2025
nasdaq = ['OPTN', 'UONEK', 'SCOR', 'AXON', 'STRS', 'CMRX', 'BSBK', 'FNLC',
'NVCR', 'FNKO','NVEC', 'SLAB', 'MSBI', 'AGNC', 'NMRK', 'OPTX', 'IFRX', 'CVCO',
...]
combined_data = pd.DataFrame()
Part2.Data Cleaning
Convert data format Handle missing value Process the outliers Validate
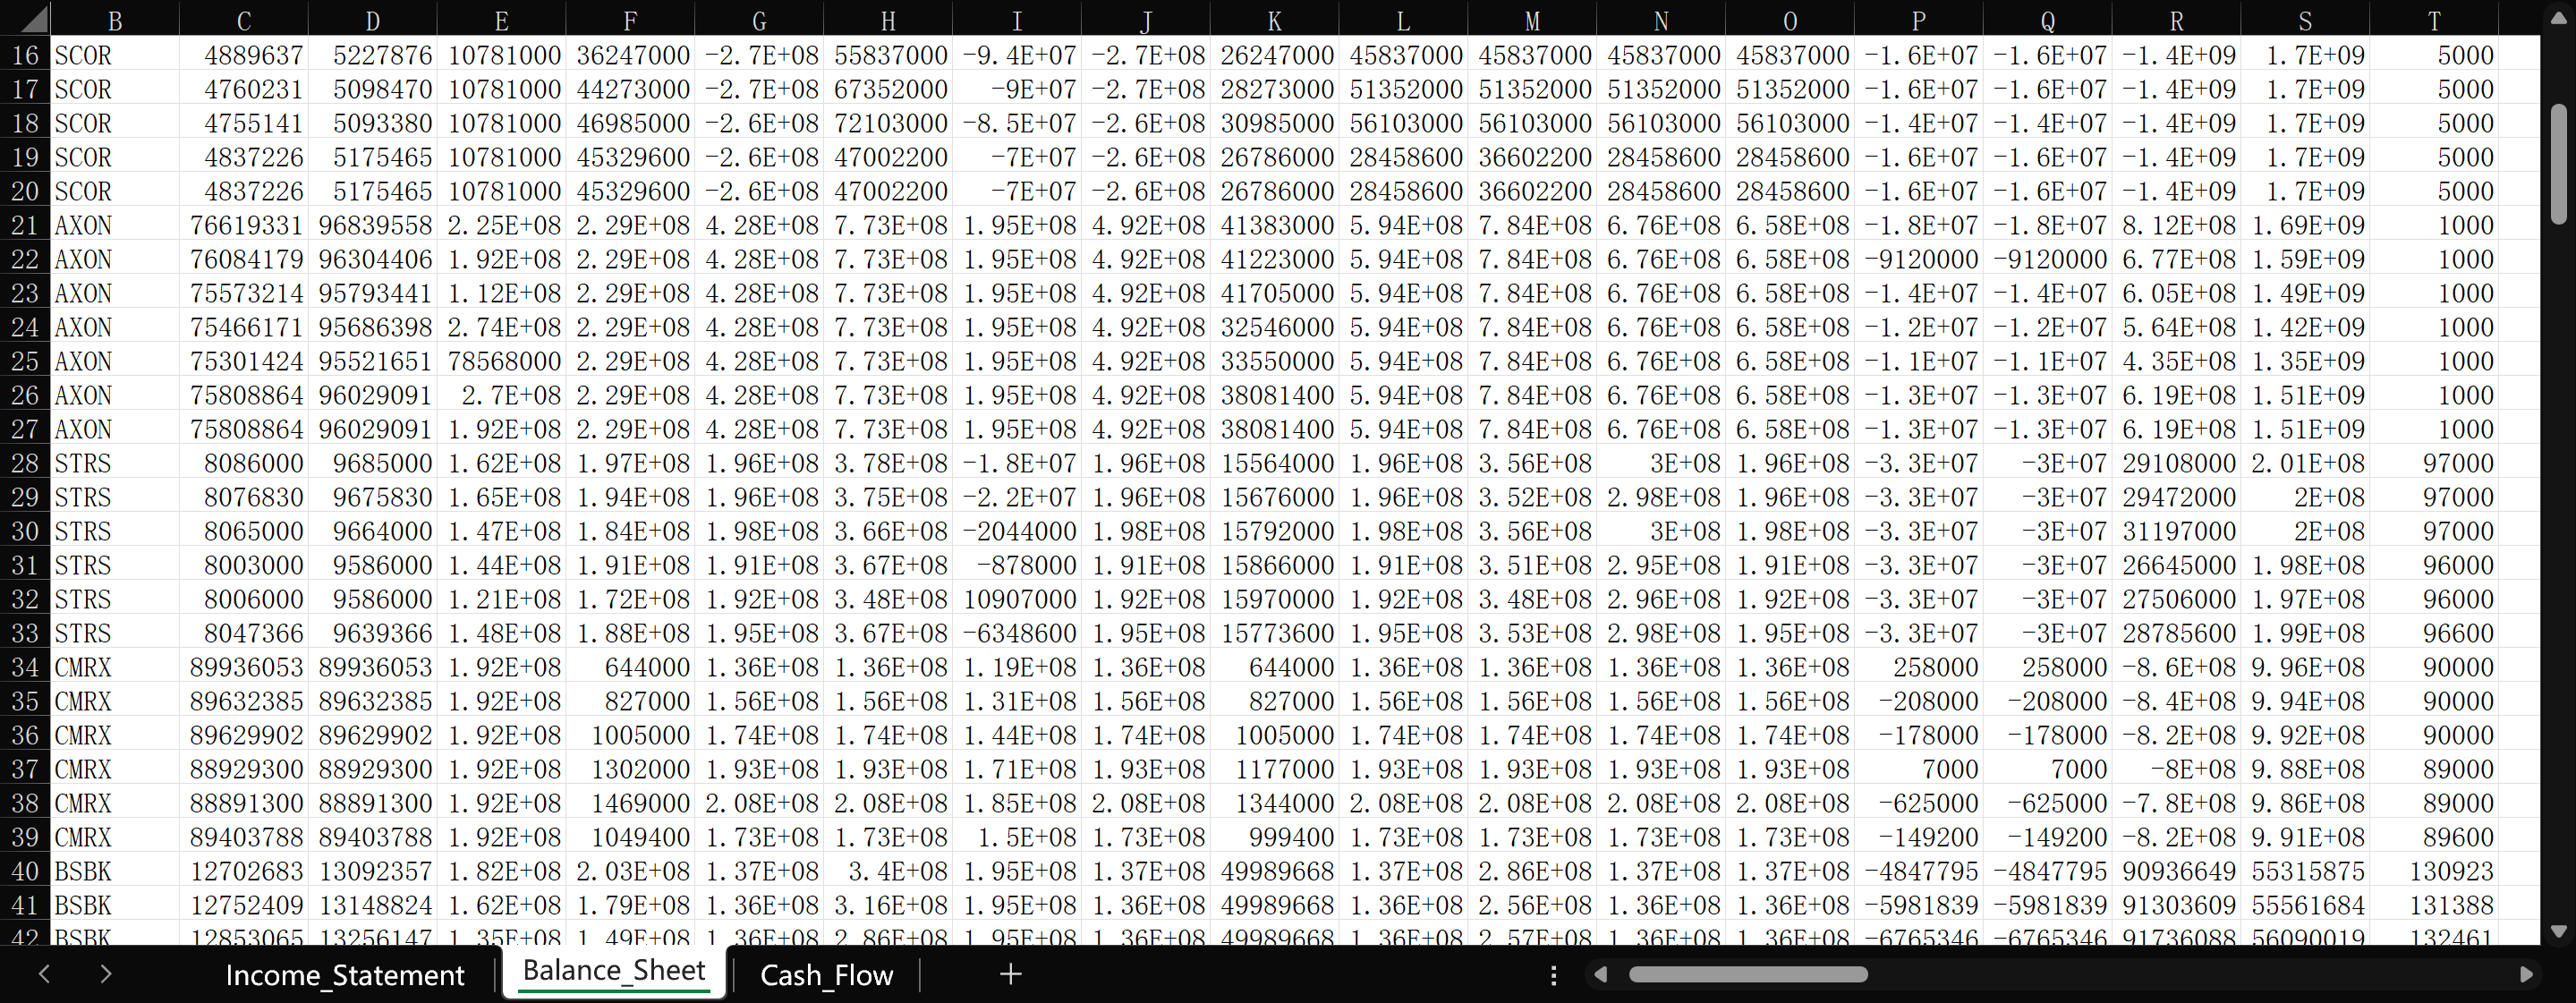
Before Clean
After clean
####### Don’t forget to validate.
> def handle_missing(df, threshold=0.75):
      for col in numeric_cols:
          # Step 1: Fill in missing values with the historical mean of the same␣
          # Step 2: If the company has no historical data, fill in the entire␣
def validate_missing(df, name):
    total_missing = df.select_dtypes(include=np.number).isnull().sum().sum()
    print(f"{name}total missing: {total_missing}")
In data collection, it is important to standardize the format at the beginning of the collection process and strictly classify the sources of data reporting
Part3.Data Visualizaion.
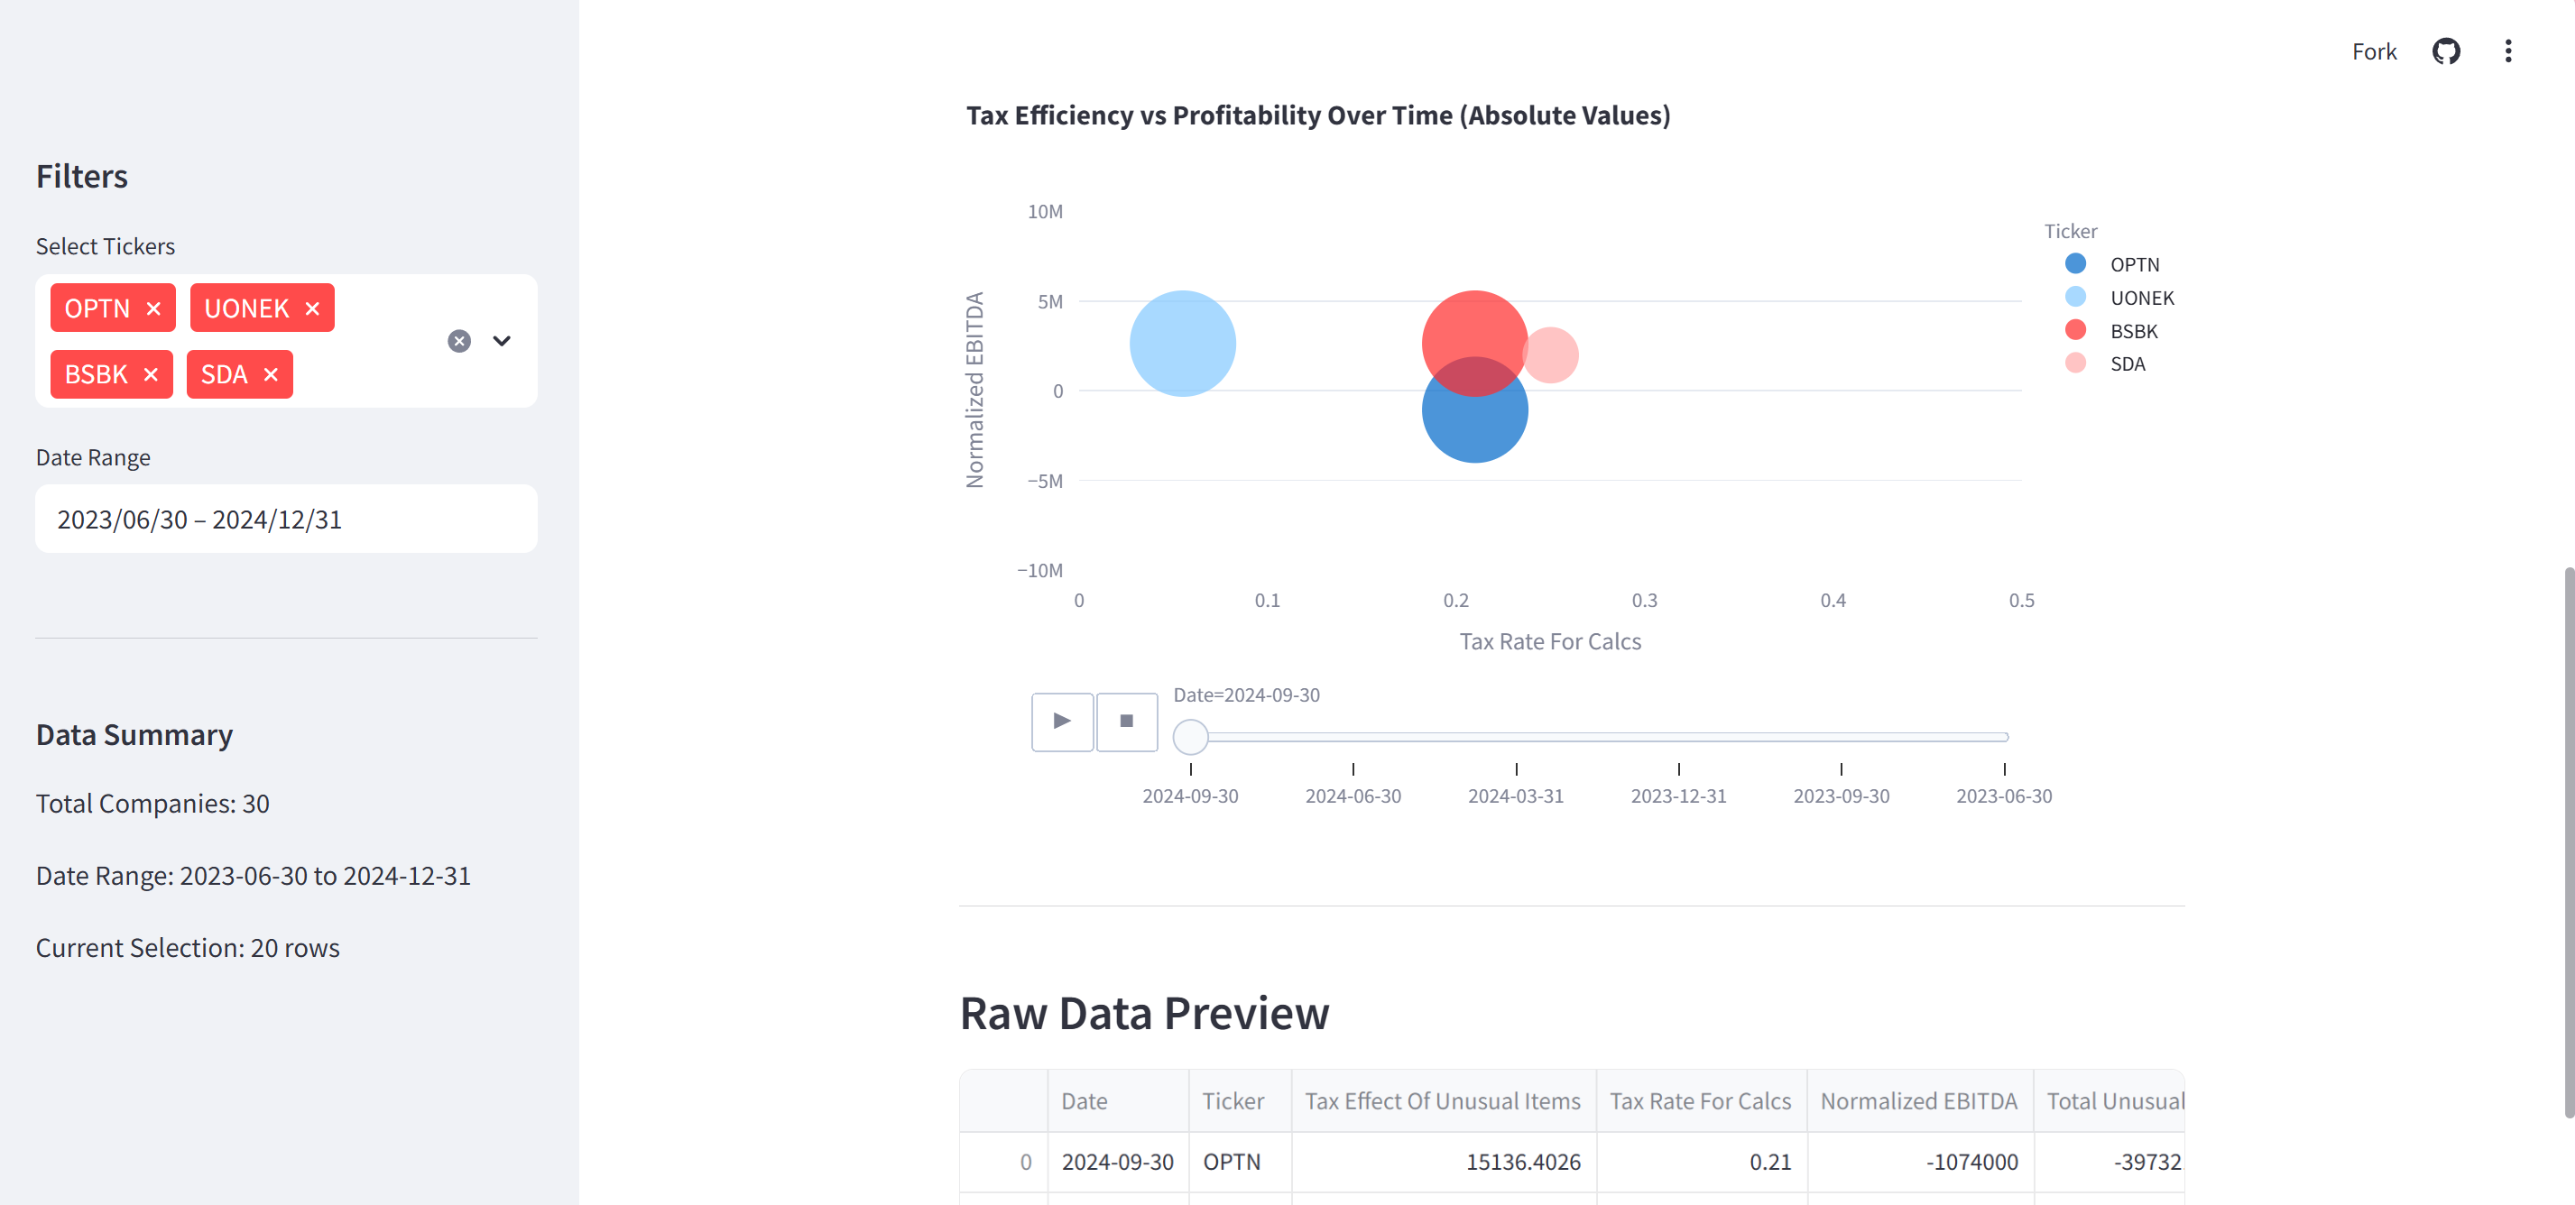
I want to analyze the financial situation of these companies from shallow to deep. I need to have a rough estimate of their cash flow, study their income and expenditure situation, and attempt to break down the various components of their cash flow and understand their decisions. And judge from the final financial impact whether these decisions are effective.
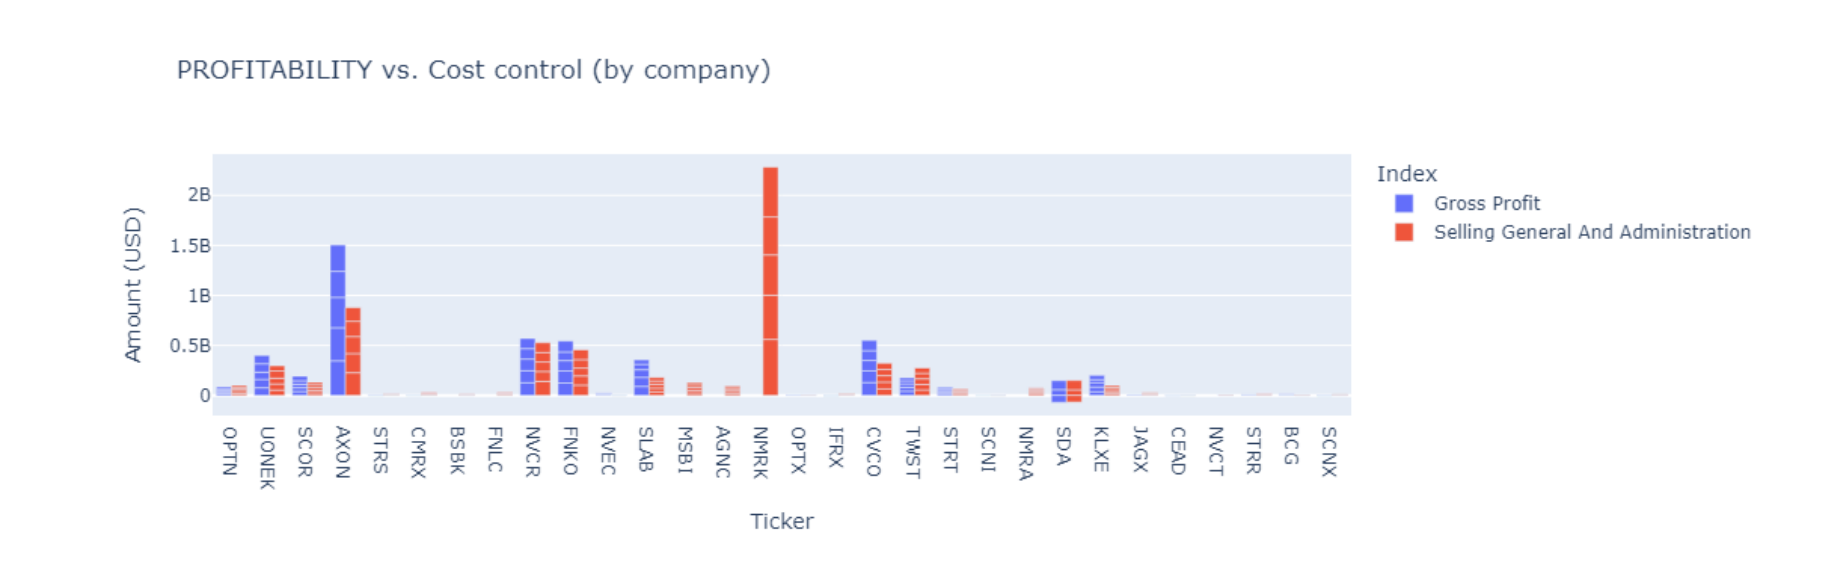
PROFITABILITY vs. Cost control
I choose a bar chart to horizontally compare the gross profit and sales management expenses of different companies. High gross profit but a large proportion of expenses may imply efficiency issues.Many companies have a high proportion of operating expenses, and the differences in operating and revenue levels between these companies are often significant. Therefore, directly comparing their operating amounts may not be a good choice. I chose to analyze their asset and cash flow composition to determine the operational health of this company.
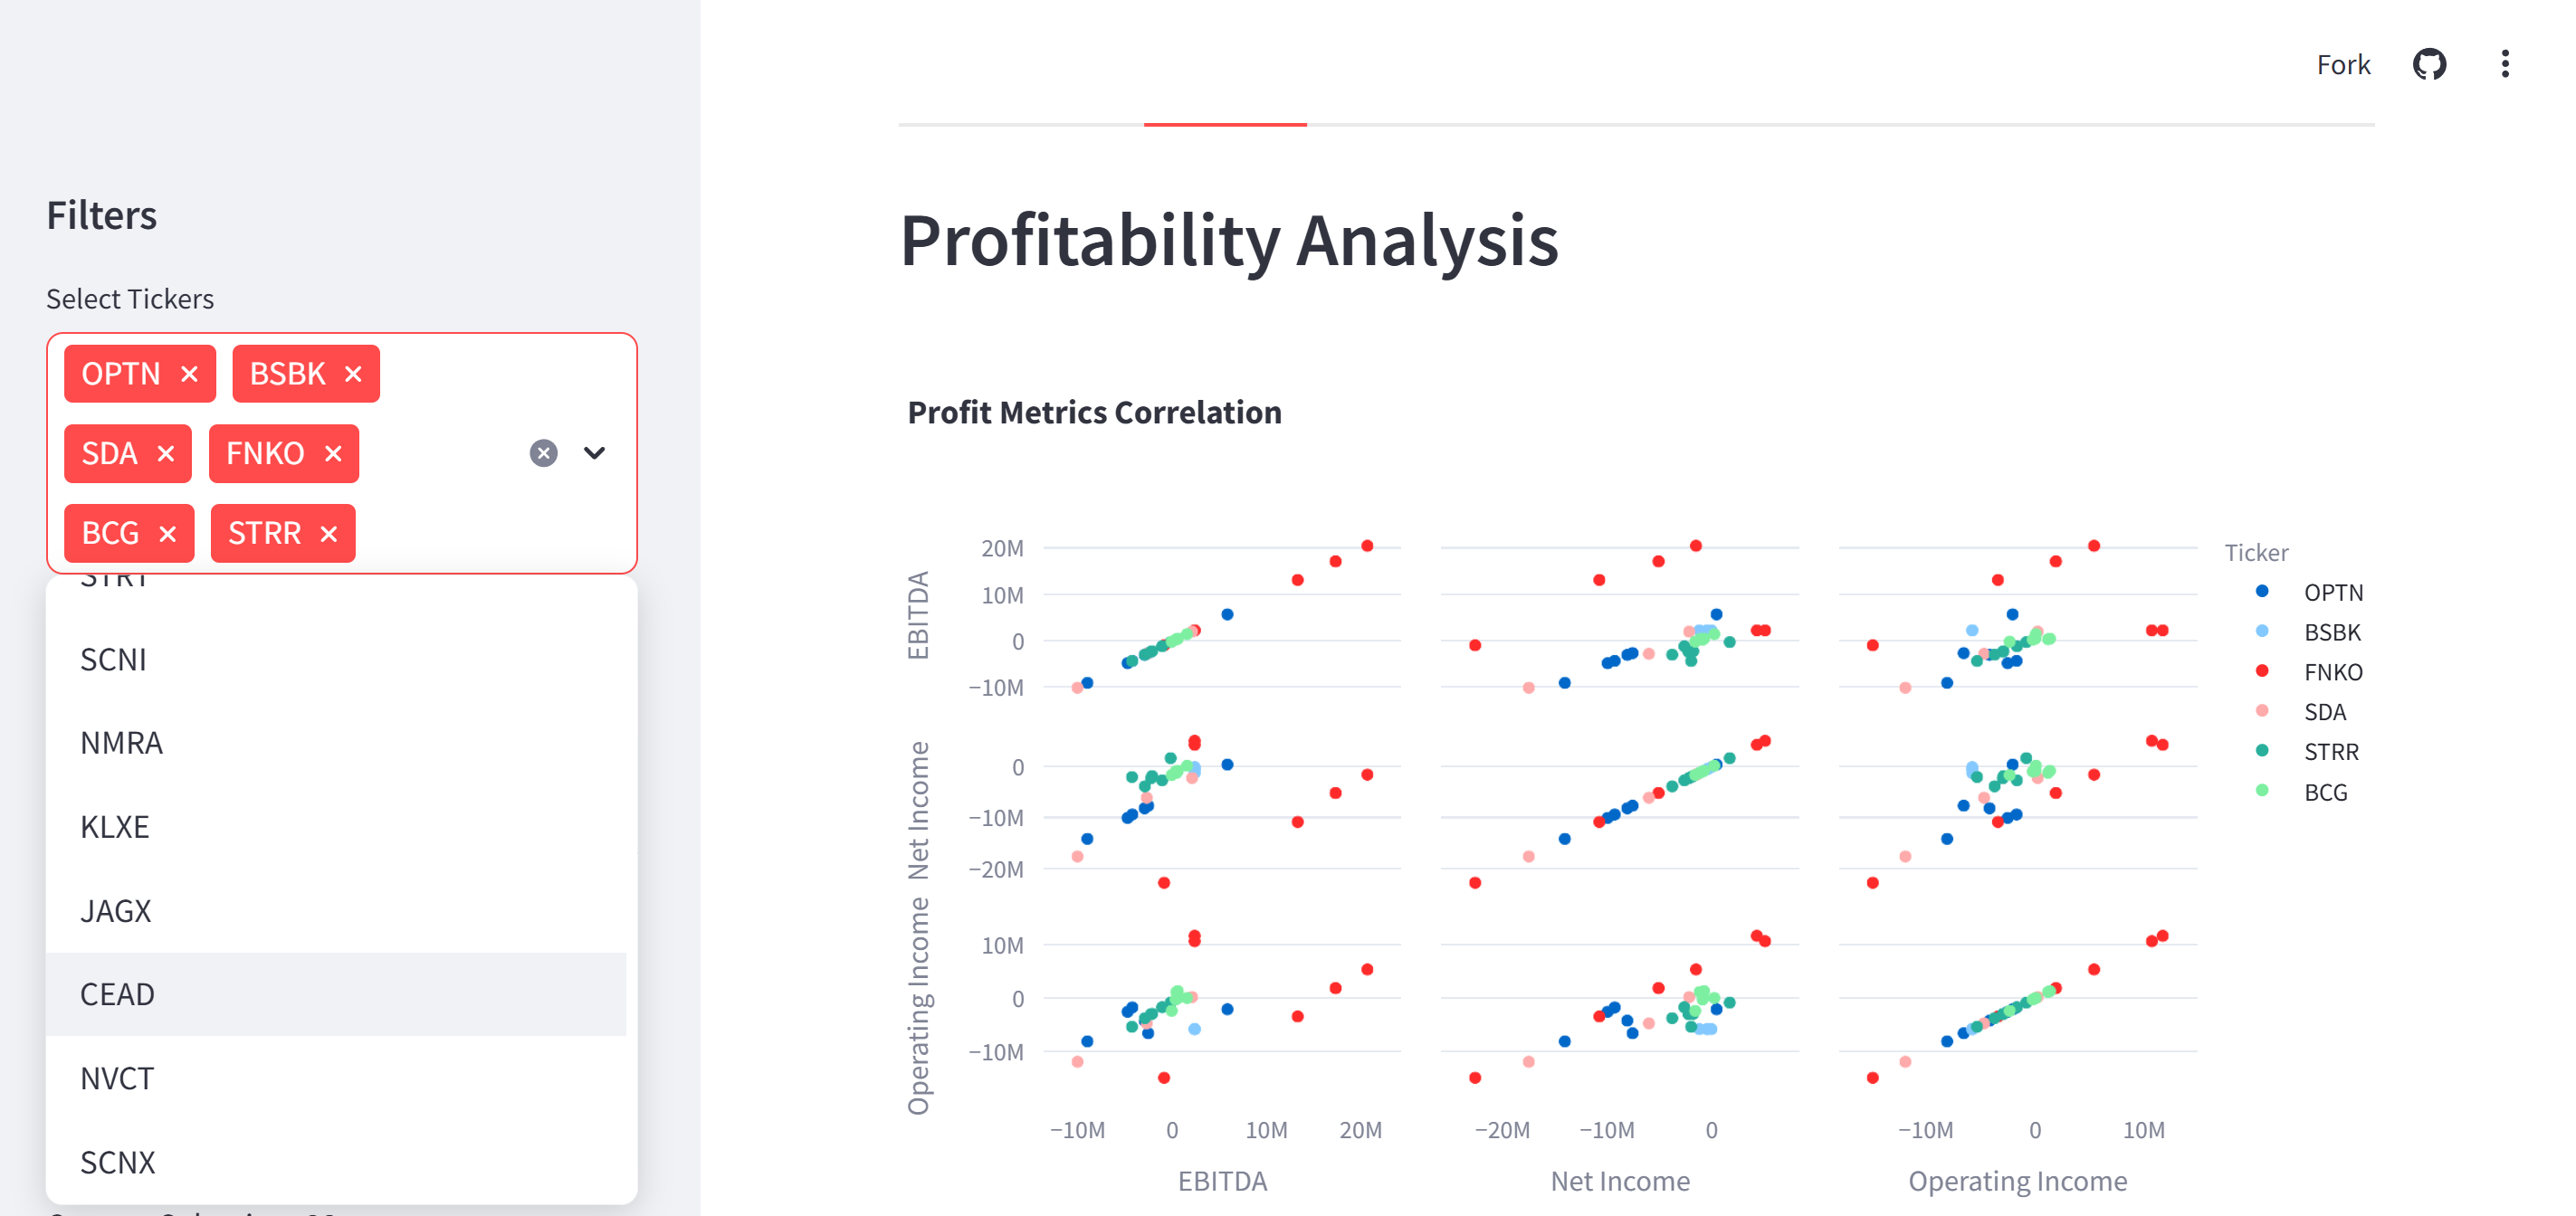
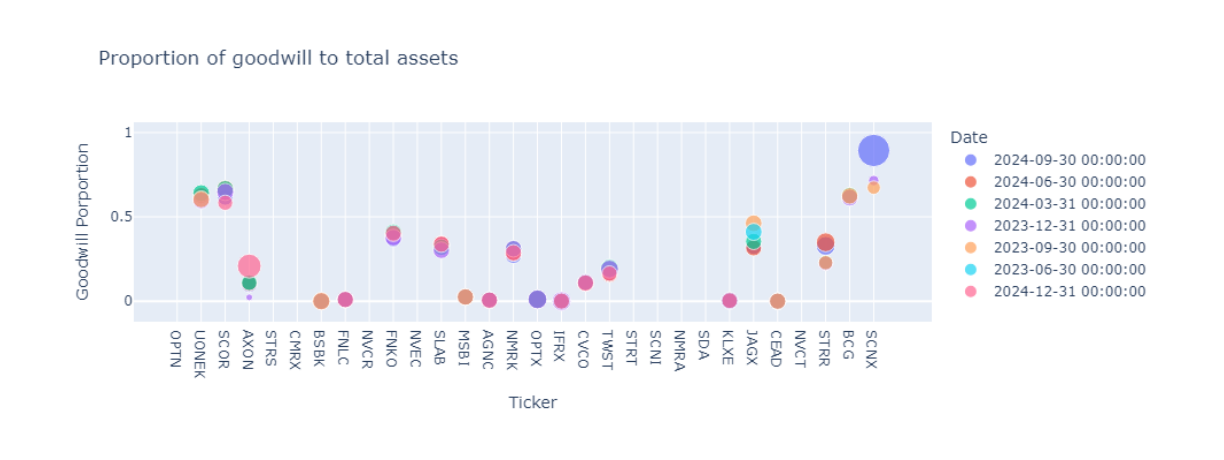
Excessive operating expenses do not necessarily mean that a company has the risk of cost control. Companies also have similar goodwill assets that can prove their potential financing ability to counter potential operating expenses. Therefore, we use scatter plots to observe which companies have a higher proportion of goodwill.Through Group by Ticker, I calculate the total goodwill of each Ticker, and then calculate the proportion of goodwill assets.
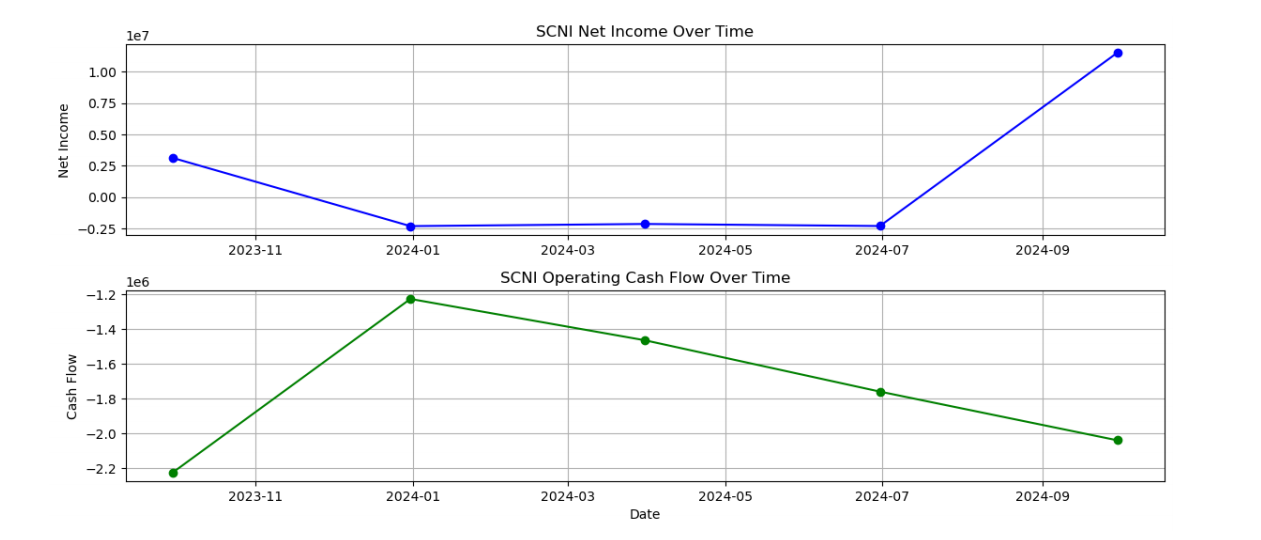
The asset liability ratio is usually determined by the profitability and cost of a company. I compared the profit trend and cost control trend of SCNI to identify the underlying reasons for the decline in the asset liability r.But it still needs to be compared whether it has stickiness to shareholders and whether it really invests costs in the work environment ,to check if these changes are made for long term.
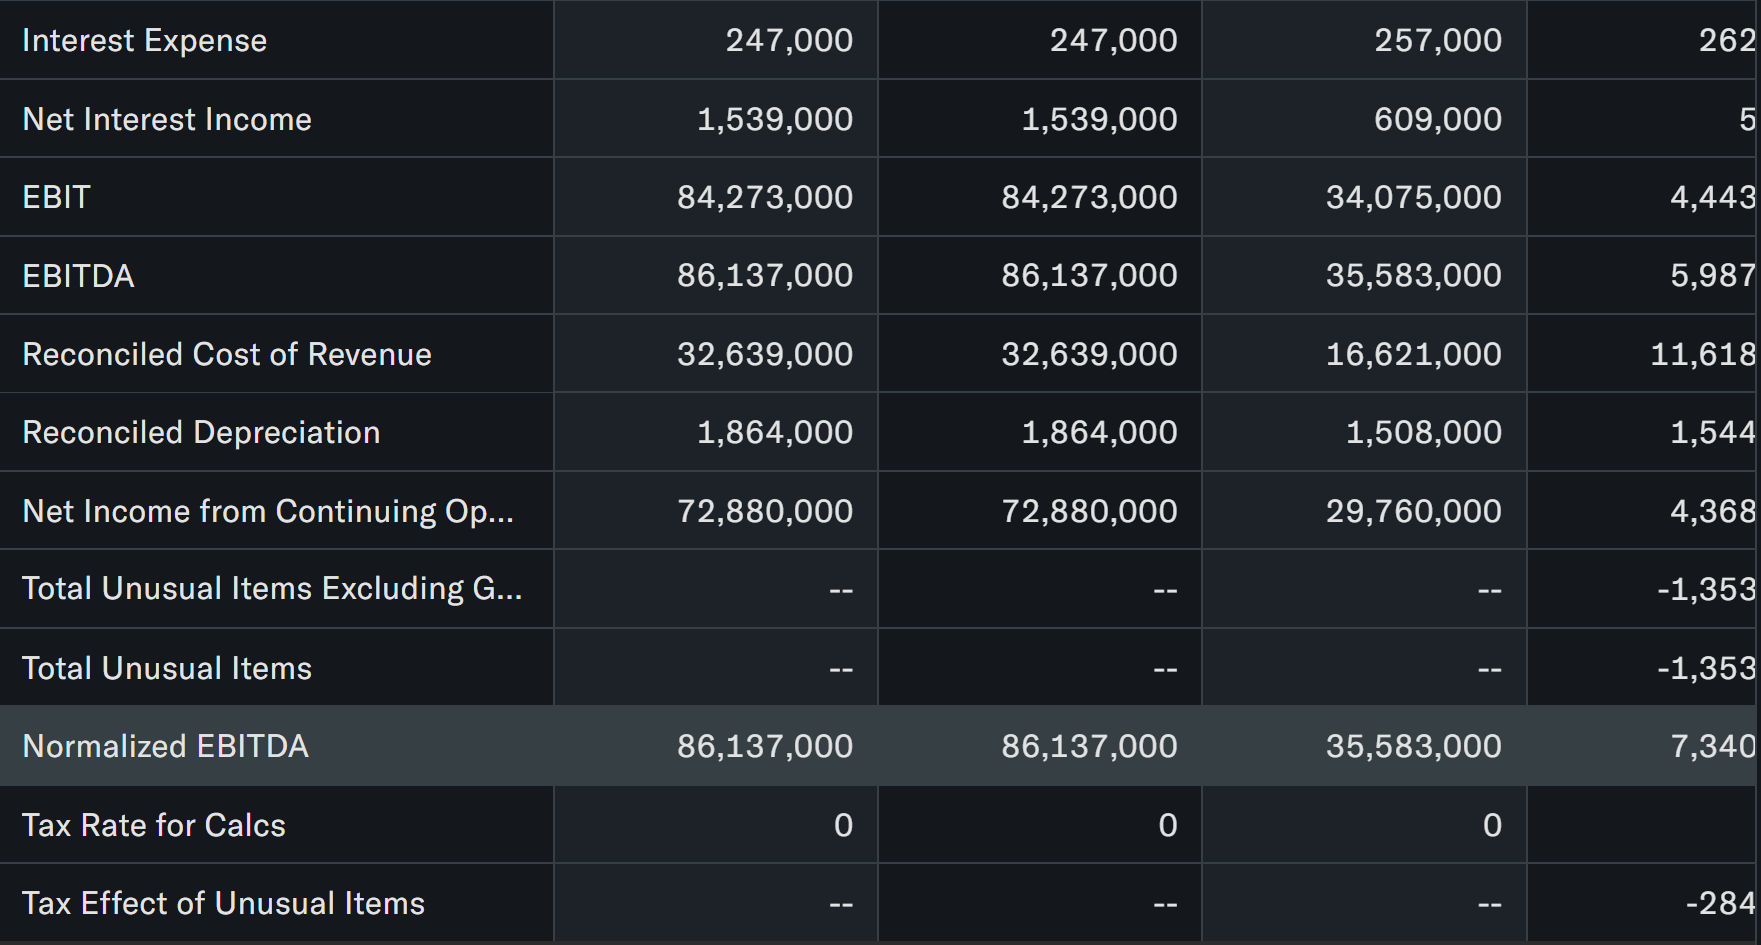
After analyzing the funding trends of SCNI, I selected five more segmented categories of funding flows to examine the specific numbers. I directly selected from the previously defined table, using the date as the first column, and used red and black colors on three items to distinguish positive and negative numbers, in order to make better judgments.It can be seen that the consumption of working capital has surged ,and the Dividends remained the same amount.
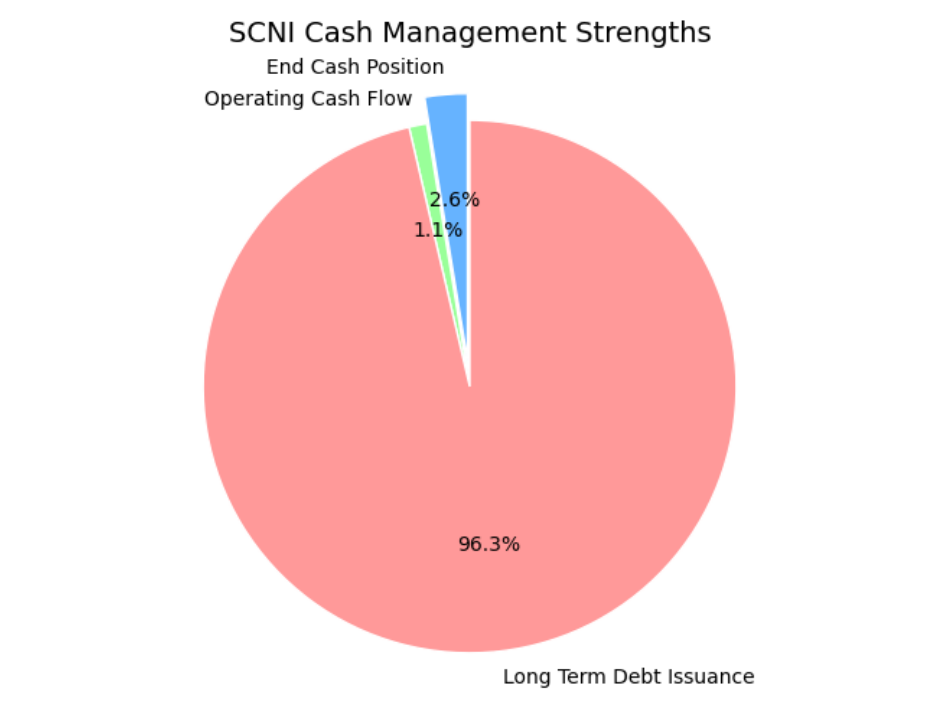
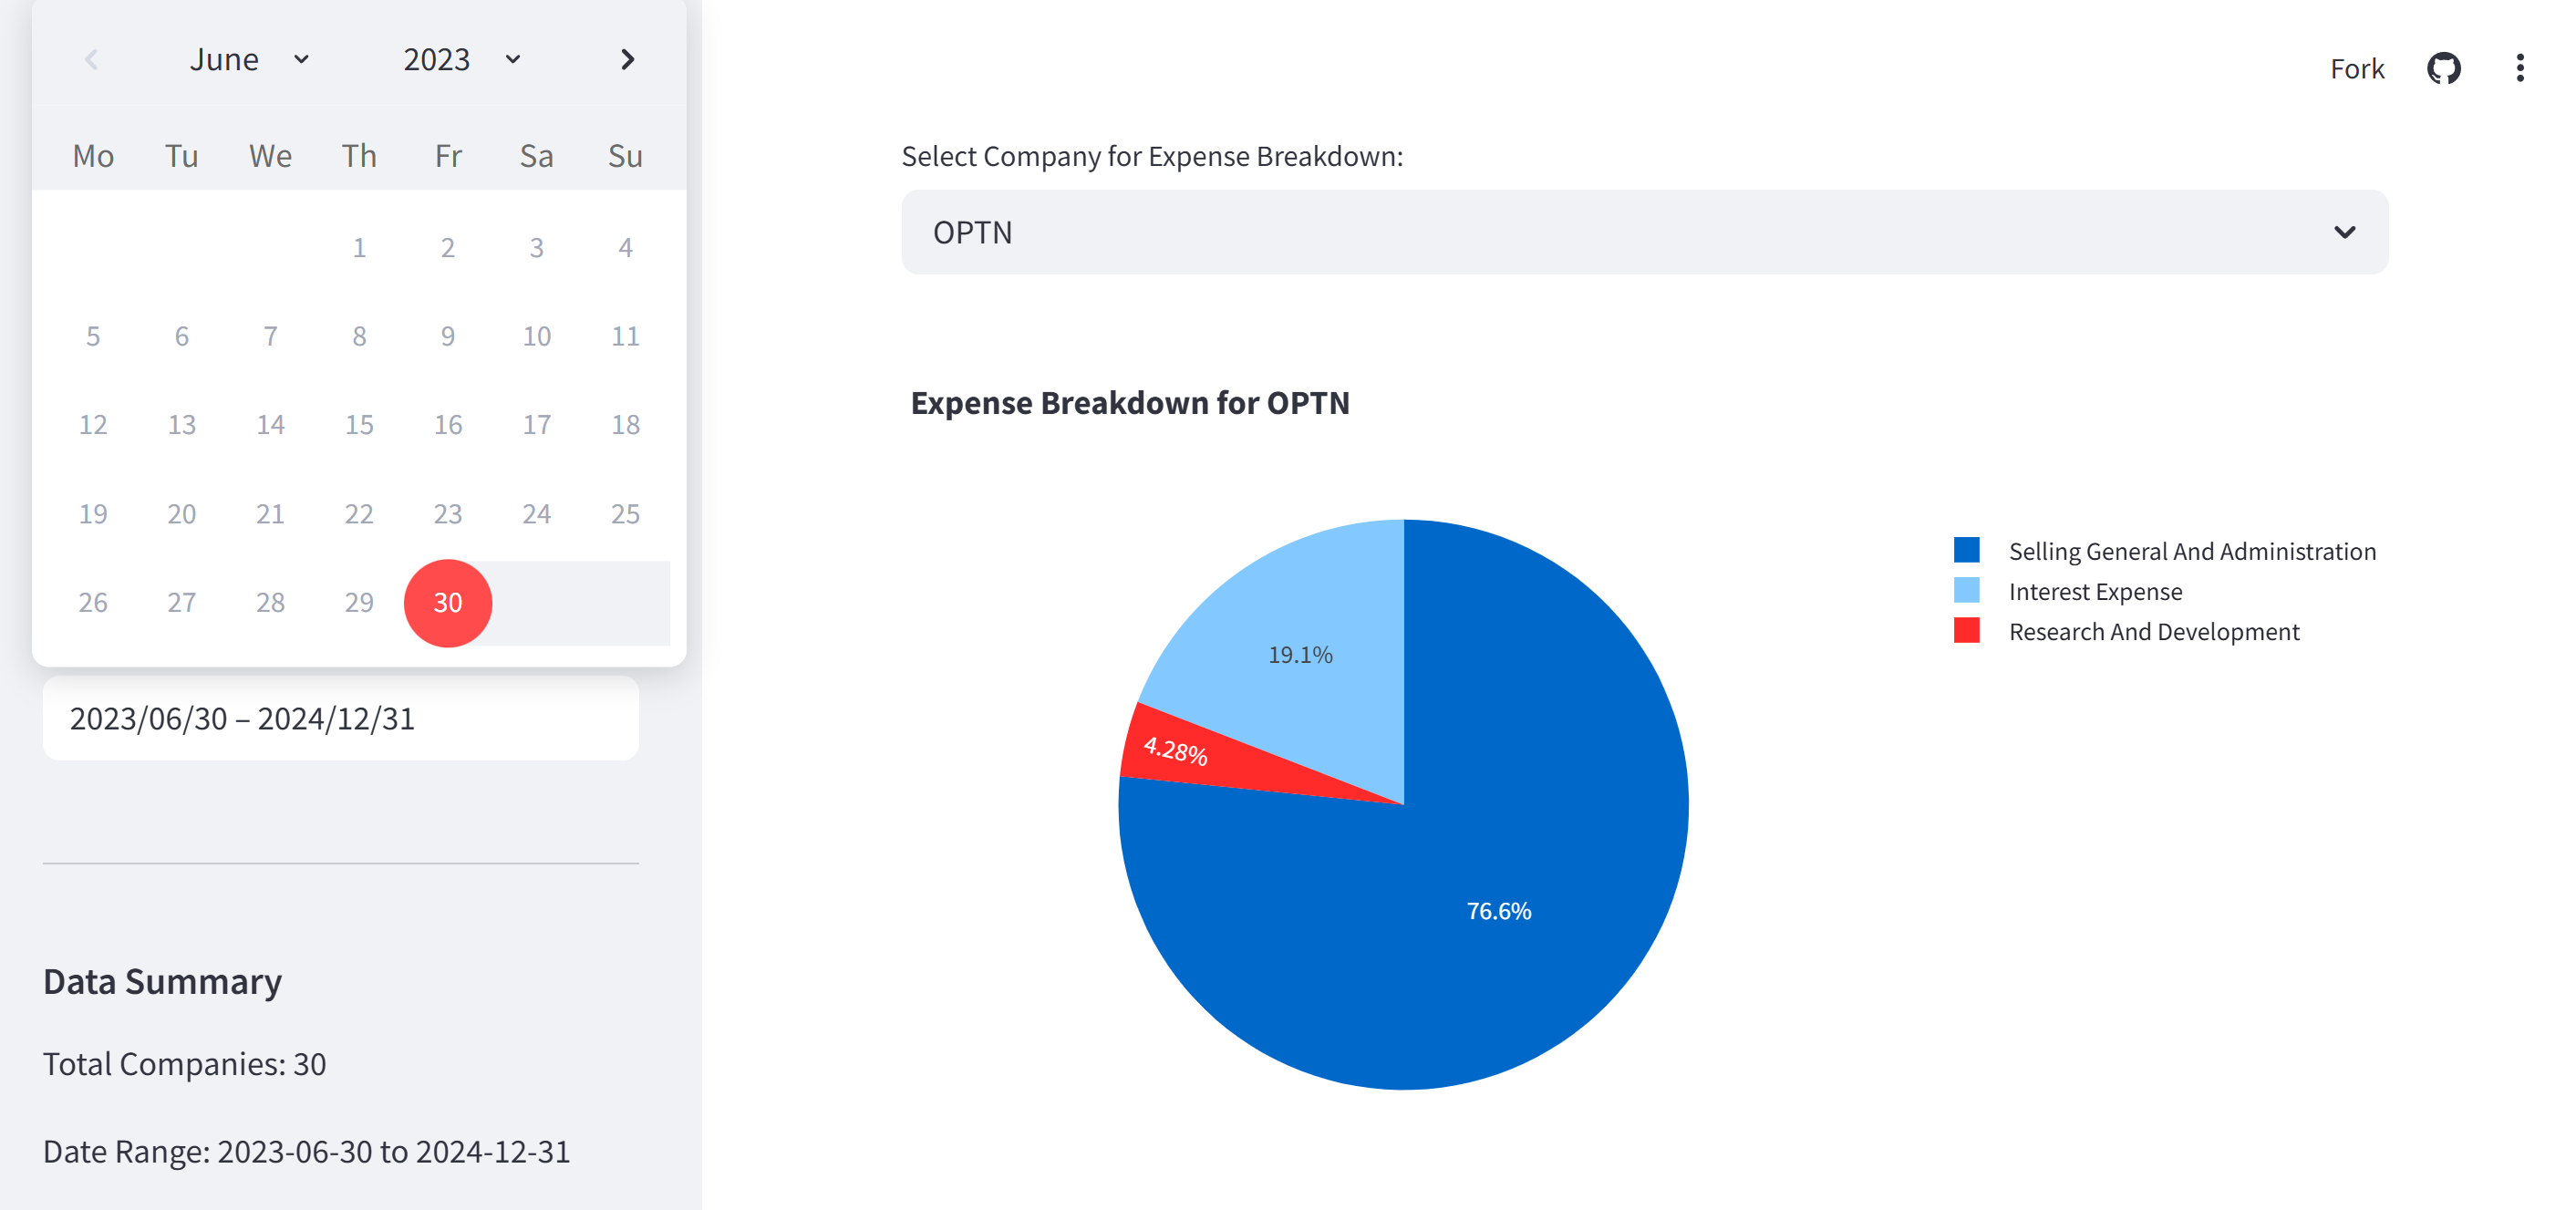
After analyzing the flow of funds, I wanted to assess the company’s ability to withstand risks, so I introduced a long term debt issue outside of operating cash to observe its fund composition. As it was to observe the proportion of fund composition, I chose a pie chart.It can be seen that long term debt occupies a very exaggerated proportion.
Outcome & Link
In summary, in order to evaluate the operational status of the company, I have divided the overall calculation into four parts: calculating the proportion of operating costs, measuring the health of cash flow, the degree of decline in dividends and reputation assets, and long-term debt issuance.
You can calculate by this formula also, this website will not collect any information from you :)
📈 Financial Health Formula
Health rate =
0.4 × [1 - (Cost/Revenue)²] (When ≤70%)
0.4 × e⁻²⁽Cost rate⁻⁰⋅⁷⁾ (Cost>70%)
+ 0.3 × (1 - Dividend volatility) × goodwill%
+ 0.3 × tanh(Debt/(2×Revenue))
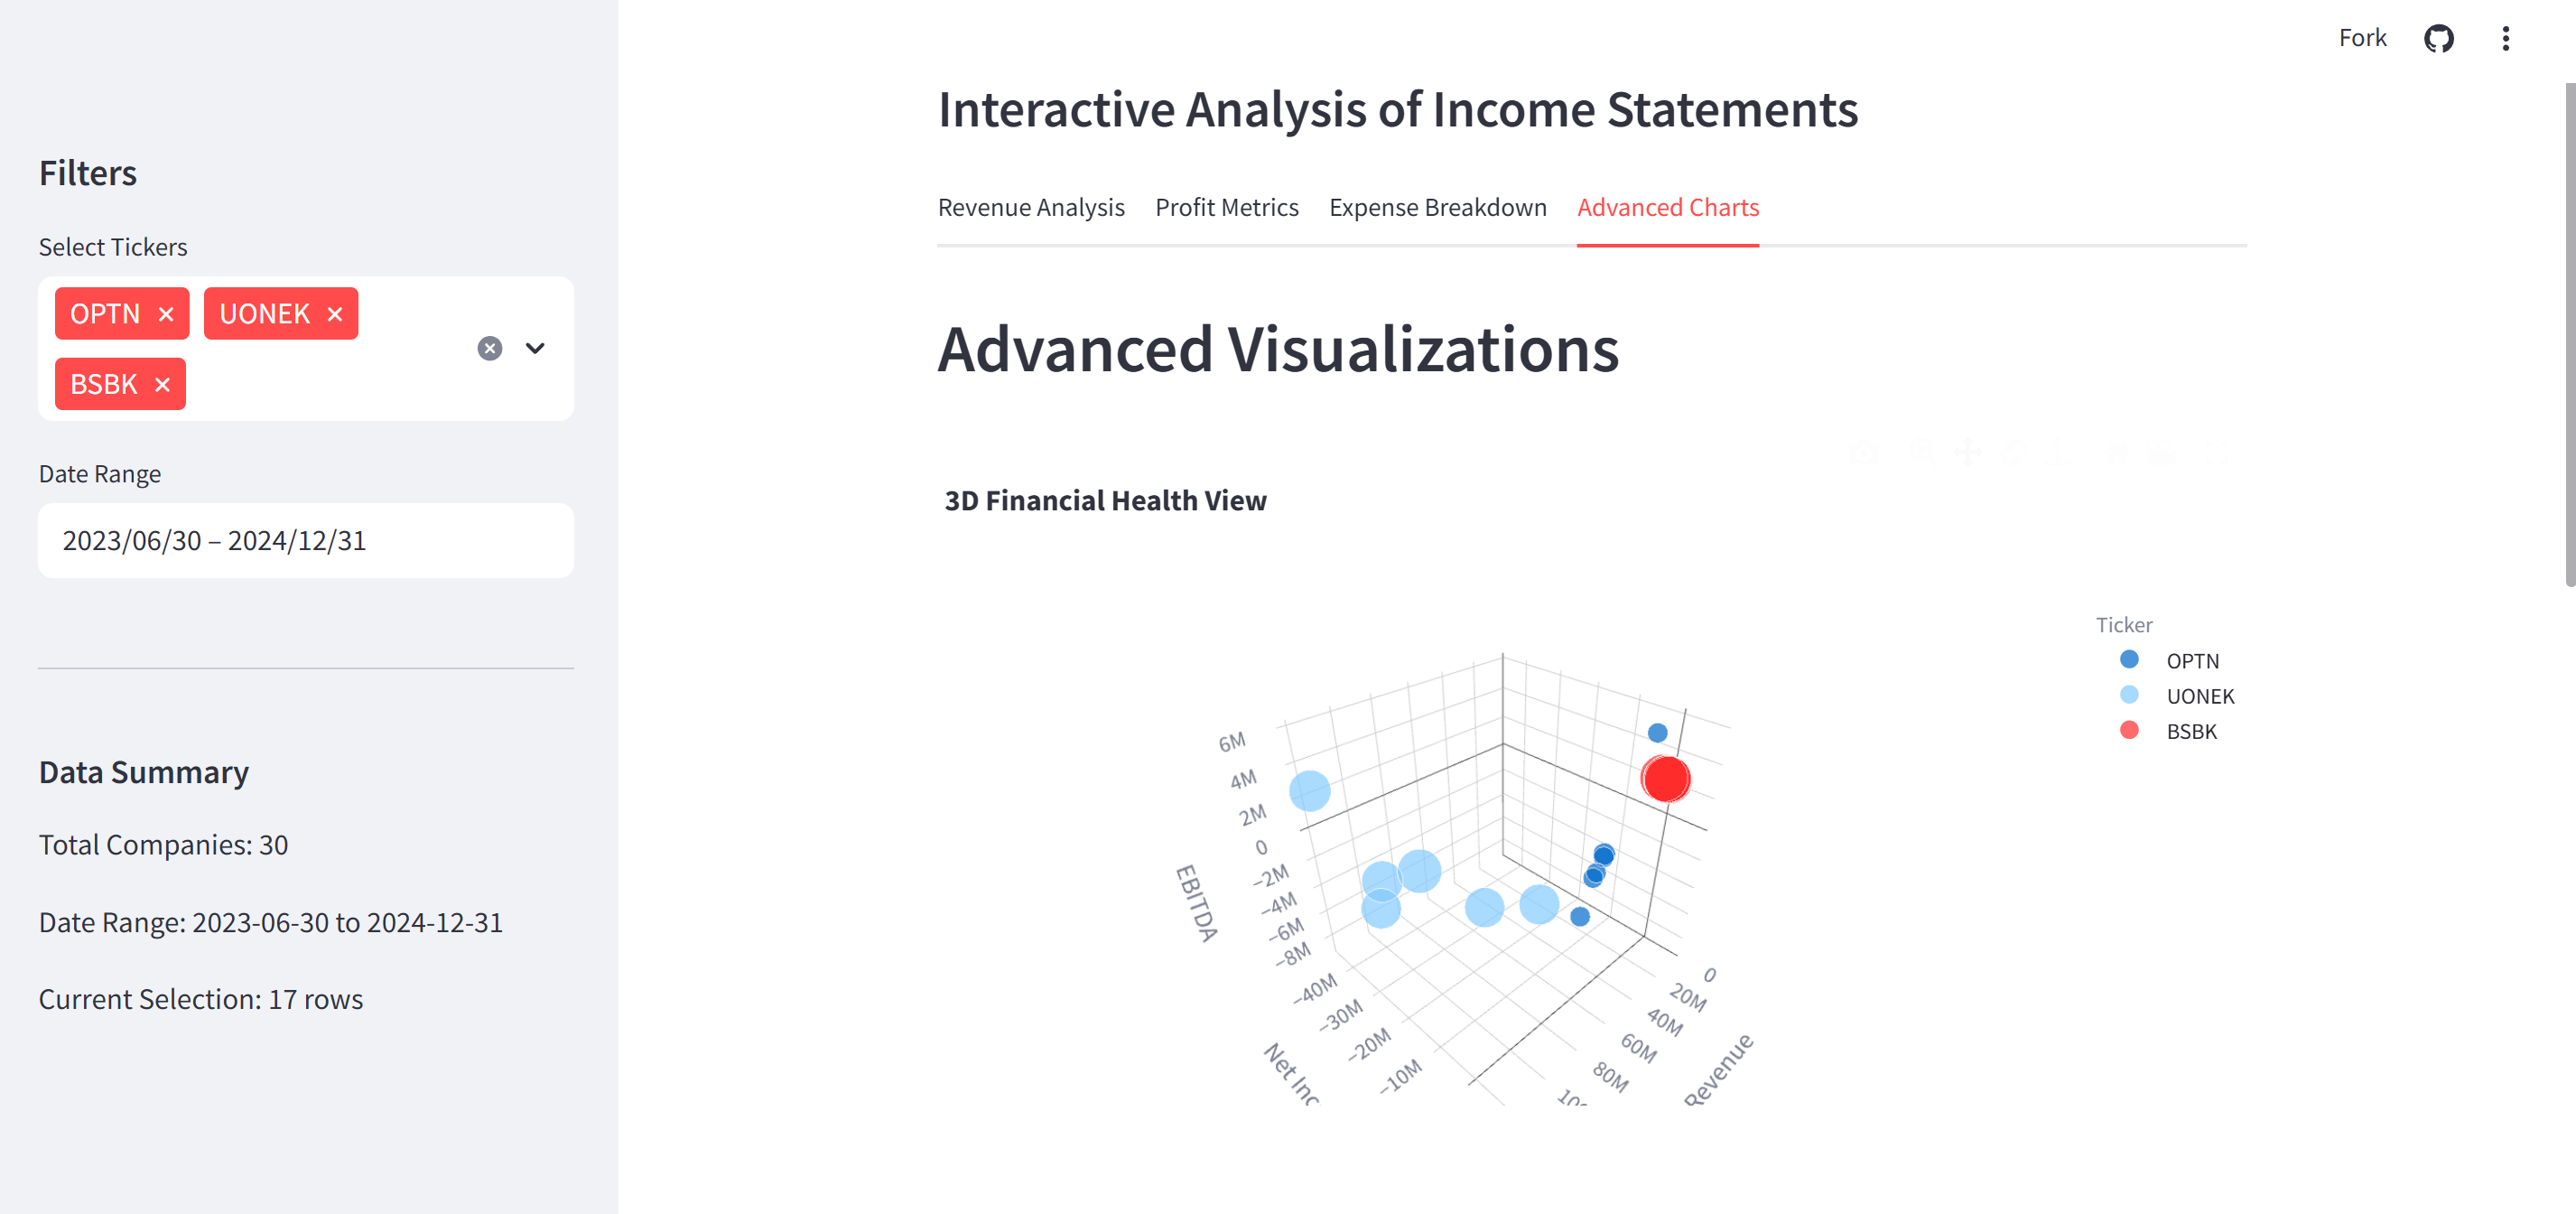
I have created interactive websites for various indicators of this analysis. Please click to view my Dashboard.